How We Built an IoT Remote Monitoring Solution to Transform Data Into Insights
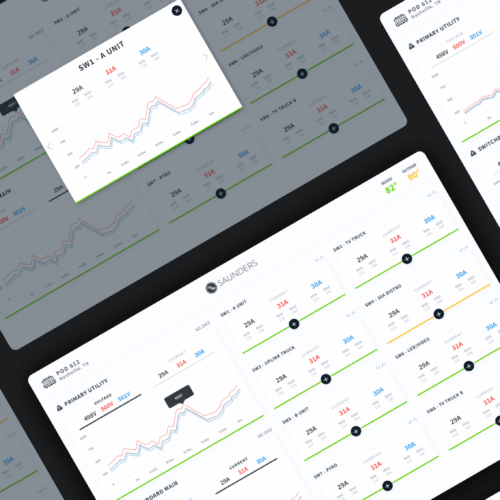
Very teamed up with Saunders Electric to develop a custom operational dashboard for their onsite operators, unlocking data insights for the entire team.

Saunders Electric
Innovative leader in energy-saving systems
IoT Solutions
Hardware Engineering, Software Development, Product Design
Project Timelines
12 weeks
Tech Stack
Python, Flask, React, AWS, SQLite, MQTT
Saunders Electric has provided reliable portable power for live broadcasts and Hollywood productions since 1952. The company is an innovative leader in energy-saving systems and an alternative energy partner with Sandia National Laboratories.
Very teamed up with Saunders Electric to develop a custom operational dashboard for their onsite operators, unlocking data insights for the entire team. The team also set up data aggregation to a centrally managed cloud platform powered by Amazon Web Services.
Our work had a lasting impact, empowering Saunders Electric to garner new insights from their data to offer a more reliable customer experience.
The Challenge
Saunders uses power distribution units to ensure that customers receive consistent and uninterrupted power. Local power conversions and battery and generator backups offer protection in the event of a local outage.
Operators need to monitor local power supplies and record each customer’s power draw and total utilization rate while onsite.
The Limitations of Existing Technology
A POD is an on-site, mobile container that provides power conversion, distribution, and backups. It manages power inputs from the local grid and the local backup generator.
Before working with Very, Saunders Electric monitored these power inputs and outputs locally, using a C++ utility to interface directly to Modbus.
This setup provided visibility only into the current state of each POD. The limitations of its technology made it impossible to view data as a time series and to save the data to a centrally managed service for remote monitoring.
Saunders Electric needed an easier and more affordable foundation to expand their product’s capabilities.
Project Goals
- Leverage existing interfaces to hardware peripherals made available through the local network and Modbus interface.
- Increase data visibility for POD operators by offering real-time insights into the quality of service and overall utilization of power.
- Alert operators and management when input levels are beyond an acceptable range.
- Aggregate all data in a central location to allow for future analytics and reporting.
The Solution
Very designed, built, and deployed a system of hardware, software, and cloud-driven applications. This system allows on-site operators to track and record multiple metrics in a single, real-time dashboard.
We designed our solution with simplicity and ease of implementation in mind.
With increased data visibility, operators can now identify changes in power usage. Alarms and notifications offer additional support and reassurance. This system is currently in active beta and runs in parallel with the existing monitoring software on multiple PODs.
System Architecture
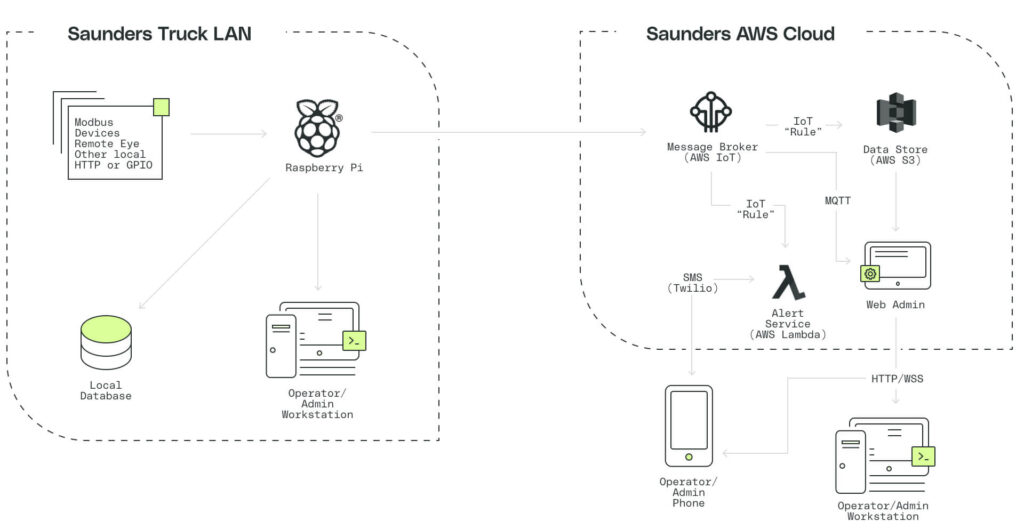
A Python application running on a local Raspberry Pi 3.0 polls real-time data through the local Modbus interface. A local RESTful API, which is also hosted on the Raspberry Pi, makes the data available to the dashboard.
Each Raspberry Pi is responsible for polling the Modbus, storing the metrics and data in a local SQL database, and hosting the dashboard web application and the local API serving the web application. When the devices have internet access, data is streamed to AWS over MQTT and stored to AWS S3 for future analysis. Additionally, the AWS Lambda functions to Twilio to send text message alerts when measurements go outside of the acceptable ranges.
Hardware Stack
- Raspberry Pi 3.0 – Model B
- 32 GB SD card local storage
- Powered via micro-USB
- Communication to Modbus and internet over local Ethernet connection
Software Stack
- Python software stack running on the Raspberry Pi
- Flask micro-framework utilized to build RESTful API for data publication to the front end
- React single page Javascript application served via Flask as a static asset
- Python application polls Modbus for data collection at regular intervals
- SQLite database stores measurements locally on the Raspberry Pi 3.0
- Data is recorded to the cloud through AWS MQTT
- Alerts are managed by AWS Lambda functions, which communicate to Twilio for issuing notifications and handling the responses
Cloud / AWS
- All cloud-based services are hosted in Amazon Web Services
- Measurements from the field are collected using MQTT
- Measurements are stored in AWS S3 for future analysis
Very built the interfaces and dashboards using modern web technologies for quick installation. We designed a solution for compatibility with the computers already running in each POD. Implementation for Saunders Electric required just three easy steps:
- Install a Raspberry Pi
- Connect it to the local ethernet
- Configure the appropriate network addresses
Updates to this system can be deployed without any operator/system administrator intervention, utilizing modern continuous deployment strategies that leverage Yocto and Mender.
The Impact: From Spreadsheets to Dashboards
Very developed a custom dashboard for Saunders Electric’s on-site operators. The team also set up data aggregation to a centrally managed cloud platform powered by Amazon Web Services.
The increased on-site data visibility provided operational benefits and efficiency gains. The alerts and notifications allow operators to proactively identify and address power usage issues so they can offer a reliable customer experience.
Now that Saunders Electric has access to all of their data in a central cloud server, they can access robust reporting tools to identify areas for optimization.
The data benefits have had a lasting impact that extends across teams. Members of the sales team can create dashboards to explain the return on investment to clients, a significant upgrade from using spreadsheets.
With Very, Saunders Electric has elevated its processes to offer a modern and intuitive customer experience.
Let's talk about your vision for a powerful IoT solution.

